This walkthrough describes how you can use OData to combine data from Microsoft Dynamics NAV 2015 with data from Windows Azure DataMarket.
 About This Walkthrough
This walkthrough illustrates the following tasks:
-
Creating a Microsoft Dynamics NAV query.
-
Publishing your query as a web service.
-
Publishing a page as a web service.
-
Verifying the availability of the web services that use a browser.
-
Using the PowerPivot add-in for Excel to import data from your Microsoft Dynamics NAV web services as new worksheets.
-
Connecting to demographic data available from Windows Azure DataMarket.
-
Creating a pivot table in Excel that combines Microsoft Dynamics NAV data with data from Windows Azure DataMarket.
Prerequisites
To complete this walkthrough, you will need:
-
Microsoft Dynamics NAV 2015 with a developer license.
-
CRONUS International Ltd. demonstration database.
-
Microsoft Excel 2013 with Microsoft PowerPivot enabled, or Microsoft Excel 2010 with the PowerPivot add-in for Excel 2010 installed. For more information, see PowerPivot Download Page.
-
A Windows Live ID for accessing data from Windows Azure Marketplace. For more information about Windows Live ID, see the Windows Live ID site. To obtain a Windows Live ID, go to the sign-up page.
Story
Victor, the business system developer at CRONUS International Ltd., has been asked by his manager Tim to create a data visualization that will show total sales to customers in different countries/regions, and how those countries/regions align with Key Development Indicators, which are a measure of national/regional affluence. Tim tells Victor that he can find information about Key Development Indicators on Windows Azure Marketplace. Victor assesses the assignment and decides that he can use OData web services to bring Microsoft Dynamics NAV data to Excel, where he can merge it with economic data from Windows Azure Marketplace.
Creating a Microsoft Dynamics NAV Query
You create a query to capture data about sales to individual customers.
 Note Note |
|---|
| For more information about how to create more advanced queries that combine data from multiple Microsoft Dynamics NAV pages, see Walkthrough: Creating a Query to Link Two Tables, Walkthrough: Creating a Query That Uses a Totaling Method and Sorting, or Walkthrough: Creating a Query to Link Three Tables. |
To create a query to capture data about sales to customers
In the development environment, on the Tools menu, choose Object Designer.
In Object Designer, choose Query, and then choose New.
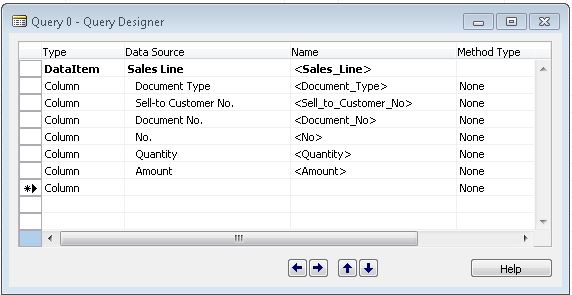
In Query Designer, on the first line, in the Data Type column, choose DataItem from the drop-down list box.
In the Data Source column, choose the Lookup button, choose the Sales Line table from the Table List window, and then choose the OK button.
On the View menu, choose Field Menu.
Select the following fields. To select multiple fields, hold down the Ctrl key and select all relevant lines.
-
Document Type
-
Sell-to Customer No.
-
Document No.
-
No.
-
Quantity
-
Amount
-
Document Type
Choose the OK button. When prompted, “Do you want to add the fields that are selected in the field menu?”, choose the Yes button.
You should see the following in Query Designer.
On the File menu, choose Save.
In the Save As window, in the ID field, enter 50005. In the Name field, enter SalesOrderInfo. Verify that the Compiled check box is selected, and then choose the OK button.
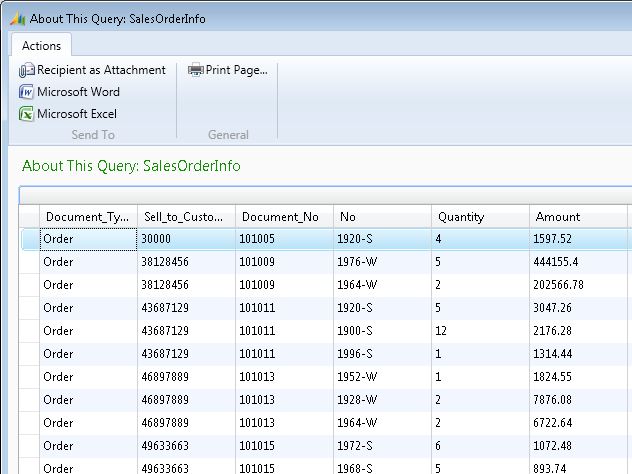
Note If 50005 is already being used by another query, you will get an error when you try to save the query. If so, use another ID. In Object Designer, choose query 50005, and then choose Run. When you run a query, you can view the data in the dataset.
Close Query Designer and the development environment.
Publishing a Query and a Page as Web Services
You register and publish a web service by using the Microsoft Dynamics NAV Windows client.
In the Microsoft Dynamics NAV Windows client in the Search box, enter Web services, and then choose Web Services.
The Web Services page opens.
In the Web Services page, choose New.
The New - Web Services page opens.
In the Object Type column, select Page. In the Object ID column, enter 21, and then in the Service Name column, enter Customer.
Select the Published column.
Press the Tab key to move the pointer to a new line in the New - Web Services page.
In the Object Type column, select Query. In the Object ID column, enter 50005, and then in the Service Name column, enter SalesOrderInfo.
Select the Published column.
Choose the OK button to exit the New - Web Services page.
Verifying Web Service Availability
You should verify that the web services that you just created are available over the Internet. When exposing a web service, you must open the port for consumers of your web service to access it. If necessary, have your system administrator add the port through Windows Firewall on the computer that is running Microsoft Dynamics NAV Server. The default port for OData web services is 7048 and can be configured by using Microsoft Dynamics NAV Server Administration tool. For more information, see Microsoft Dynamics NAV Server Administration Tool.
To verify web service availability
Start Internet Explorer.
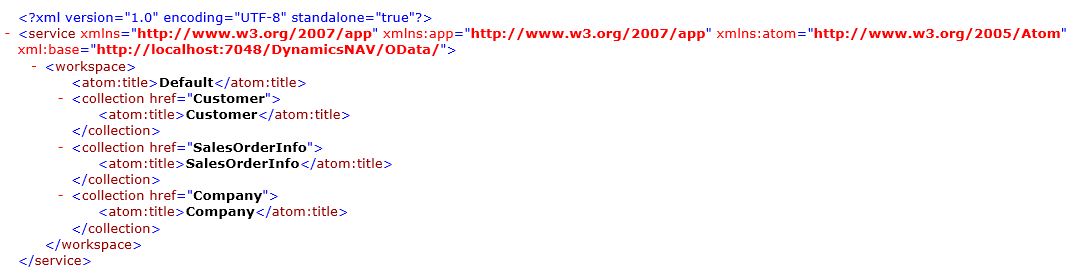
In the Address field, enter a URI in this format: http://<Server>:<WebServicePort>/<ServerInstance>/OData.
For example:http://localhost:7048/DynamicsNAV72/OData
The browser should now show the web services that you have published, in the format of an AtomPub document.
 Important
 You may want to modify your Internet Explorer settings to display the actual XML for a feed instead of the feed content that has changed. Choose Internet Options, choose Content, choose Feeds and Web Slices, and then clear the Turn on feed reading view check box. Restart Internet Explorer to enable the new setting.
Importing Microsoft Dynamics NAV Data into Excel
In this procedure, you import Microsoft Dynamics NAV web service data into Excel.
To import Microsoft Dynamics NAV data into Excel
Start Microsoft Excel. In Excel, on the PowerPivot tab, in the Launch group, choose PowerPivot Window.
In PowerPivot, on the Home tab, in the Get External Data group, choose From Data Feeds.
In the Data Feed Url field, enter the OData URI, such as http://localhost:7048/DynamicsNAV72/OData. Choose the Next button.
Verify that Customer and SalesOrderInfo appear in the Source Table column. Place a check mark in the left column next to these two rows, and then choose Finish.
After you see the Success message, choose the Close button.
You should now see data from the Customer page and the SalesOrderInfo query displayed as Excel workbooks. You can switch between pages using the tabs at the bottom of the Excel window.
Enhancing the Microsoft Dynamics NAV Data by Adding a Column
Examine the SalesOrderInfo workbook in Excel. Notice that it has a Quantity column and an Amount column. In your final output you may want to show total sales per company, this is the Quantity multiplied by Amount. An easy way to achieve that is to add a column to the workbook that calculates that product.
To enhance Microsoft Dynamics NAV data by adding a column
In the SalesOrderInfo workbook, choose Add Column, which is on the right side of the last data column.
Move the pointer down to the first cell in the new column and type an equal sign (=).
This indicates that you are creating a formula.
Click the header row of the Quantity column.
This starts to build your formula.
 Copy Code
=SalesOrderInfo[Quantity]
Type an asterisk (*) at the end of the formula to indicate multiplication.
Click the header row of the Amount column.
This completes the formula.
Copy Code=SalesOrderInfo[Quantity]*SalesOrderInfo[Amount]
Note If you prefer, you can type the complete formula instead of clicking the header row. Press Return to indicate that the formula is finished.
Right-click the header of CalculatedColumn1 and choose Rename Column.
Type QuantityByAmount as the new column name.
Save the modified SalesOrderInfo workbook.
Importing Data from Azure DataMarket
The Windows Azure Marketplace is an online market where you can buy and sell finished Software as a Service (SaaS) applications and premium datasets. The Windows Azure Marketplace offers many different kinds of data, including demographic, environment, financial, retail, and sports data. In this walkthrough, you use demographic data about development standards in different countries and regions.
To import data from Azure DataMarket
In PowerPivot, on the Home tab, in the Get External Data group, choose From Azure DataMarket.
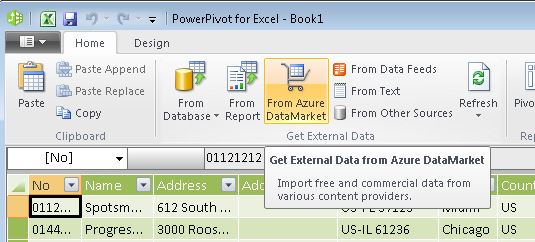
This opens a Table Import Wizard.
Select View Available Azure DataMarket datasets.
This opens a web page titled Windows Azure Marketplace.
Choose My Account and use your Windows Live ID to create a free Windows Azure Marketplace account.
After you are signed up, choose Data to return to the list of available datasets.
In the left panel, choose Free, choose Demographics, and then scroll down to choose World Development Indicators.
Read about the dataset, and then choose SIGN UP to subscribe to this data feed. On the Subscription page, choose SIGN UP again.
On the Thank You page, choose Explore This Dataset.
This takes you to a Build Your Query page. In the Build Query area on the right side, verify these values:
- Query: GetCountries
- Format: Atom
- Language Code: en
- Query: GetCountries
Choose the Run Query button.
You now see a view of the table data. Notice that the table contains two-letter country/region codes, country/region names, and additional data about the countries/regions listed. This data has enough in common with your Microsoft Dynamics NAV data to support a link between the two.
Choose Export from the narrow column on the right side of the page. Choose Excel PowerPivot, and then choose Download.
In response to the question, Do you want to open or save ServiceQuery.atomsvc from datamarket.azure.com?, choose Open.
In Excel, a dialog box prompts that you select a workbook to import the atom feed to.
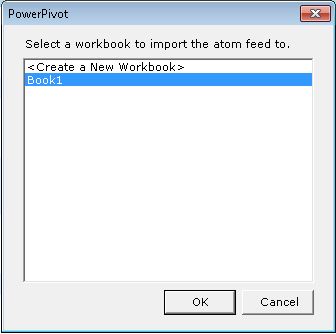
Choose the OK button.
You are now back in the Table Import Wizard. The only thing that you need to set up is your account key.
Next to the Account key field, choose Find.
Copy the default account key value from the web page.
Switch back to the Table Wizard and paste the key in the Account key field.
Choose the Next button.
Choose the Finish button.
Choose the Close button.
You now have three workbooks in PowerPivot:
- Customer, which has data from a Microsoft Dynamics NAV page.
- SalesOrderInfo, which has data from a Microsoft Dynamics NAV query.
- World Development Indicators, which has data from Windows Azure DataMarket.
These are the data sources that you will work with to create your pivot table.
Creating Relationships Between Data Sources
By creating relationships between your data sources in Excel, you make it possible to display data from multiple sources in the same pivot table.
Start by creating a relationship between the two Microsoft Dynamics NAV data sources: the Customer page and the SalesOrderInfo query. Both sources have a column that identifies the customer number, so this link is straightforward.
Then create a relationship between the respective columns on the Customer tab and on the World Development Indicators tab that use two-letter abbreviations to identify countries/regions.
To create relationships between data sources
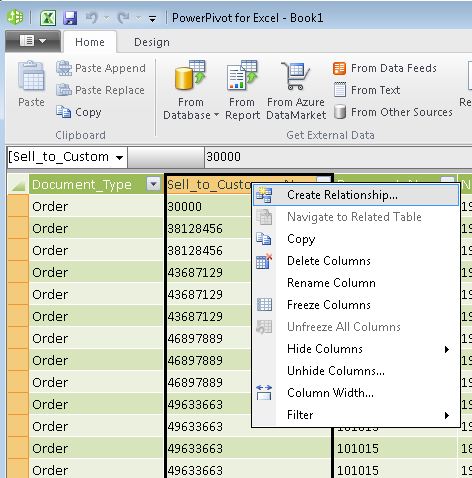
Go to the SalesOrderInfo tab in PowerPivot for Excel, right-click the header row for the Sell_to_Customer_No column, and then from the list of commands, select Create Relationship.
In the Create Relationship dialog box, in the Related Lookup Table field, choose Customer.
In the Related Lookup Column field, choose No.
Choose the Create button.
In PowerPivot for Excel, go to the Customer tab, right-click the header row for the Country_Region_Code column, and from the list of commands, select Create Relationship.
In the Create Relationship dialog box, in the Related Lookup Table field, choose World Development Indicators.
In the Related Lookup Column field, choose CodeIso2Letter.
Choose the Create button.
Building a Pivot Table
All your previous work comes together as you build a pivot table to integrate data from your sources. Building a pivot table is a way to select and arrange data so that you can highlight and focus on key elements.
To build a pivot table
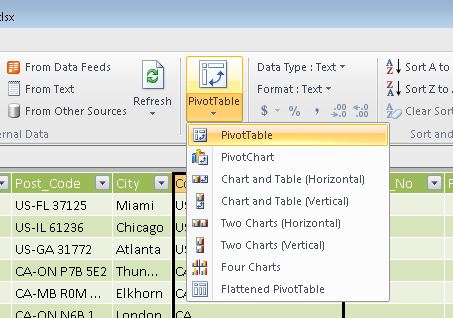
In the PowerPivot ribbon, choose PivotTable and then, in the list of commands, choose PivotTable again.
In the Create Pivot Table dialog box, choose the OK button to accept the default, New Worksheet.
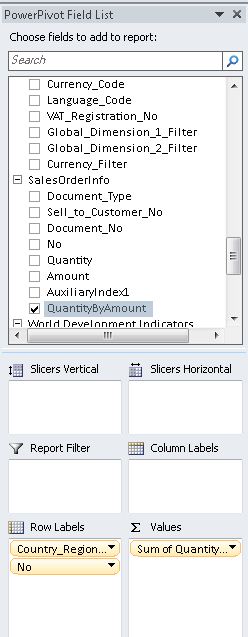
The pivot table window opens. The PowerPivot Field List on the right side lists all of the available columns in all of your data sources.
In the PowerPivot Field List, choose Country_Region_Code from the Customer field.
 Tip
Tip To quickly find a field in the field list, type part or all of the field name in the Search box that is above the list of fields, and then press Enter to highlight the first field that contains the text. You can then choose the right arrow to proceed to the next field, and so on. In the Customer field, choose No.
In the SalesOrderInfo list, choose QuantityByAmount.
PowerPivot automatically assigns these values to categories in the pivot table. Country_Region_Code and No are categorized as row labels, and QuantityByAmount as a sum.
You can design a pivot table by moving values from one to list to another, configuring items in a list, or moving items up or down in a list.
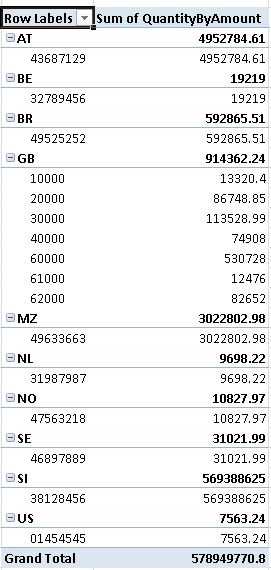
Here is what the pivot table looks like at this point. Customers are arranged by country/region, with total sales amounts.
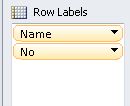
One enhancement is to replace the Country_Region_Code with the actual name of the country/region, which is available as a field in the World Development Indicators field.
Choose Name from the World Development Indicators field.
Clear the Country_Region_Code from the Customer field.
Move Name up to the top of the Row Labels list.
Choose RegionName from the World Development Indicators field, and then move it to the top of the Row Labels list.
Choose IncomeLevelName from the World Development Indicators field and then move it to second position in the Row Labels list.
This completes the list of fields. The final list looks like this.
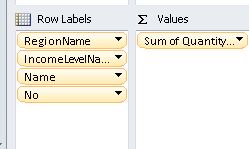
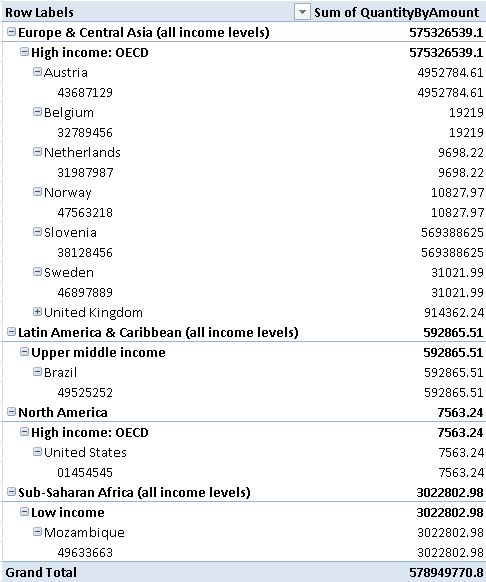
The actual pivot table looks like this.
Save the pivot table as Customers by Economic Region.xlsx.
Next Steps
Viktor’s results show that all customers are in countries/regions that are categorized as “High income.” For a different result, open page 22 Customer List in the Microsoft Dynamics NAV Windows client and reassign some companies to countries/regions that are in other income level categories. Then do the following:
-
Go the Customer workbook in PowerPivot, choose Refresh, and then choose Refresh All.
-
Go to your pivot table, choose Refresh All, and then choose Refresh All.
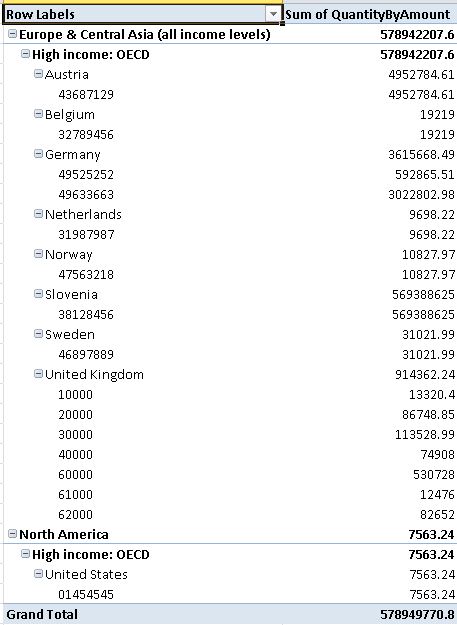
Now the final pivot table has a different result, as shown in the following example.